Cohort analysis using Data Studio and BigQuery
A cohort analysis table is used to visually display how many of the new users are still active after a period of time, like 1 day, 7 days or 1 month. Google Data Studio does not have a cohort chart by default. By using a Pivot Table with a heat map and BigQuery as data source, it is possible to obtain the same result: namely, to visually display the new users retention.
TL;DR
The live version of the sample report can be accessed from here: User retention visualization
The BigQuery source
BigQuery is a fully managed enterprise data warehouse, a scalable and distributed analysis engine capable to query terabytes in seconds and petabytes in minutes. All the BigQuery features can be found here.
For this tutorial a date range of 1 week will be used.
DECLARE DS_START_DATE STRING;
DECLARE DS_END_DATE STRING;
SET DS_START_DATE='20211127';
SET DS_END_DATE='20211203';
The first step is to identify two columns from the raw data (the timestamp and the user identifier) and to decide what is the reference period of time. The chosen period is one day is in this case:
-- select raw data
SELECT
    DISTINCT DATE(timestamp) as active_date,
    userid
FROM `codelab1-244421.demo_bq_dataset.users_log`
WHERE timestamp < TIMESTAMP_ADD(PARSE_TIMESTAMP("%Y%m%d",DS_END_DATE), INTERVAL 1 DAY)
The next step is to calculate the day when the user was first seen:
WITH raw AS (
-- select raw data
SELECT
    DISTINCT DATE(timestamp) as activity_date,
    userid
FROM `codelab1-244421.demo_bq_dataset.users_log`
WHERE timestamp < TIMESTAMP_ADD(PARSE_TIMESTAMP("%Y%m%d",DS_END_DATE), INTERVAL 1 DAY)
)
-- calculate user's first day
SELECT
    activity_date,
    FIRST_VALUE(activity_date) OVER (PARTITION BY userid ORDER BY activity_date) as first_seen,
    userid
FROM raw
followed by the calculation of the number of days between the date when the user was first seen and the current date:
WITH raw AS (
-- select raw data
SELECT
    DISTINCT DATE(timestamp) as activity_date,
    userid
FROM `codelab1-244421.demo_bq_dataset.users_log`
WHERE timestamp < TIMESTAMP_ADD(PARSE_TIMESTAMP("%Y%m%d",DS_END_DATE), INTERVAL 1 DAY)
), t_first_seen AS (
-- calculate user's first day
SELECT
    activity_date,
    FIRST_VALUE(activity_date) OVER (PARTITION BY userid ORDER BY activity_date) as first_seen,
    userid
FROM raw
)
-- calculate the number of days after the first day
SELECT
    first_seen,
    DATE_DIFF(activity_date, first_seen, DAY) AS day_order,
    userid
FROM t_first_seen
WHERE first_seen BETWEEN  PARSE_DATE("%Y%m%d",DS_START_DATE) AND PARSE_DATE("%Y%m%d",DS_END_DATE)
followed by counting the number of unique users for each pair of first_seen and day_order:
WITH raw AS (
-- select raw data
SELECT
    DISTINCT DATE(timestamp) as activity_date,
    userid
FROM `codelab1-244421.demo_bq_dataset.users_log`
WHERE timestamp < TIMESTAMP_ADD(PARSE_TIMESTAMP("%Y%m%d",DS_END_DATE), INTERVAL 1 DAY)
), t_first_seen AS (
-- calculate user's first day
SELECT
    activity_date,
    FIRST_VALUE(activity_date) OVER (PARTITION BY userid ORDER BY activity_date) as first_seen,
    userid
FROM raw
), t_day_order AS (
-- calculate the number of days after the first day
SELECT
    first_seen,
    DATE_DIFF(activity_date, first_seen, DAY) AS day_order,
    userid
FROM t_first_seen
WHERE first_seen BETWEEN  PARSE_DATE("%Y%m%d",DS_START_DATE) AND PARSE_DATE("%Y%m%d",DS_END_DATE)
)
-- counting the number of unique users for each day and day_order
SELECT
    first_seen,
    day_order,
    COUNT(DISTINCT userid) as new_users
FROM t_day_order
GROUP BY 1,2
followed by the calculation of the cohort users:
WITH raw AS (
-- select raw data
SELECT
    DISTINCT DATE(timestamp) as activity_date,
    userid
FROM `codelab1-244421.demo_bq_dataset.users_log`
WHERE timestamp < TIMESTAMP_ADD(PARSE_TIMESTAMP("%Y%m%d",DS_END_DATE), INTERVAL 1 DAY)
), t_first_seen AS (
-- calculate user's first day
SELECT
    activity_date,
    FIRST_VALUE(activity_date) OVER (PARTITION BY userid ORDER BY activity_date) as first_seen,
    userid
FROM raw
), t_day_order AS (
-- calculate the number of days after the first day
SELECT
    first_seen,
    DATE_DIFF(activity_date, first_seen, DAY) AS day_order,
    userid
FROM t_first_seen
WHERE first_seen BETWEEN  PARSE_DATE("%Y%m%d",DS_START_DATE) AND PARSE_DATE("%Y%m%d",DS_END_DATE)
), t_new_users AS (
-- counting the number of unique users for each day and day_order
SELECT
    first_seen,
    day_order,
    COUNT(DISTINCT userid) as new_users
FROM t_day_order
GROUP BY 1,2
)
-- calculate the cohort users
SELECT
    first_seen,
    day_order,
    new_users,
    FIRST_VALUE(new_users) OVER (PARTITION BY first_seen ORDER BY day_order) AS cohort_users
FROM t_new_users
and finally, followed by the calculation of the percentage of new users versus cohort users:
WITH raw AS (
-- select raw data
SELECT
    DISTINCT DATE(timestamp) as activity_date,
    userid
FROM `codelab1-244421.demo_bq_dataset.users_log`
WHERE timestamp < TIMESTAMP_ADD(PARSE_TIMESTAMP("%Y%m%d",DS_END_DATE), INTERVAL 1 DAY)
), t_first_seen AS (
-- calculate user's first day
SELECT
    activity_date,
    FIRST_VALUE(activity_date) OVER (PARTITION BY userid ORDER BY activity_date) as first_seen,
    userid
FROM raw
), t_day_order AS (
-- calculate the number of days after the first day
SELECT
    first_seen,
    DATE_DIFF(activity_date, first_seen, DAY) AS day_order,
    userid
FROM t_first_seen
WHERE first_seen BETWEEN  PARSE_DATE("%Y%m%d",DS_START_DATE) AND PARSE_DATE("%Y%m%d",DS_END_DATE)
), t_new_users AS (
-- counting the number of unique users for each day and day_order
SELECT
    first_seen,
    day_order,
    COUNT(DISTINCT userid) as new_users
FROM t_day_order
GROUP BY 1,2
), t_cohort_users AS (
-- calculate the cohort users
SELECT
    first_seen,
    day_order,
    new_users,
    FIRST_VALUE(new_users) OVER (PARTITION BY first_seen ORDER BY day_order) AS cohort_users
FROM t_new_users
)
-- calculate the cohort users percentage
SELECT
    first_seen,
    day_order,
    new_users,
    cohort_users,
    SAFE_DIVIDE(new_users, cohort_users) AS cohort_users_per
FROM t_cohort_users
ORDER BY first_seen, day_order
The result of this query will be the source of the Data Studio report.
The Data Studio report
Google Data Studio [https://datastudio.google.com/?requirelogin=1] is the main visualization tool from Google Cloud Platform. It has a rich set of connectors, many visualization widgets and beautiful sharing options.
Next are the steps to follow in order to create the report:
-
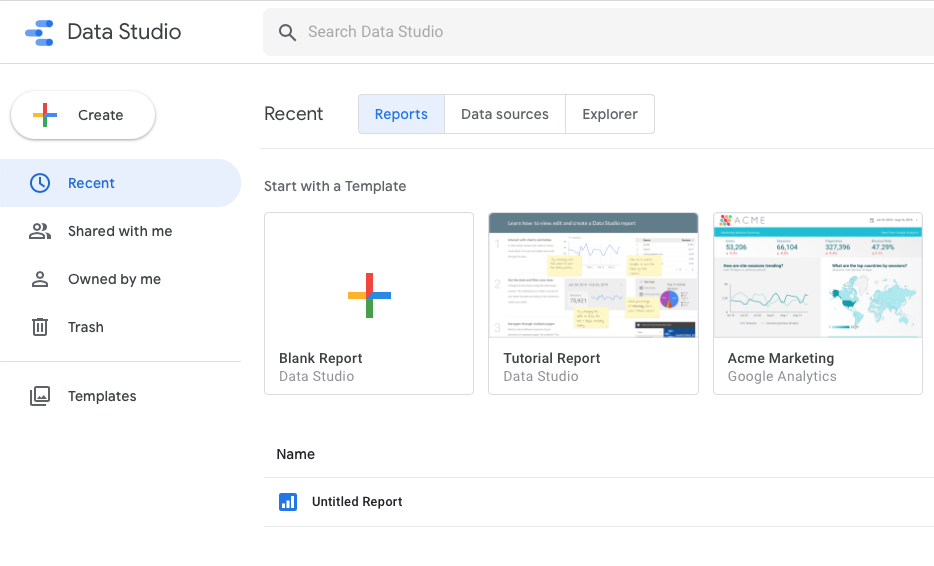
Login using a google account.
-
Click on “Blank Report” to create a new report.
- Create a new data source using BigQuery connector.
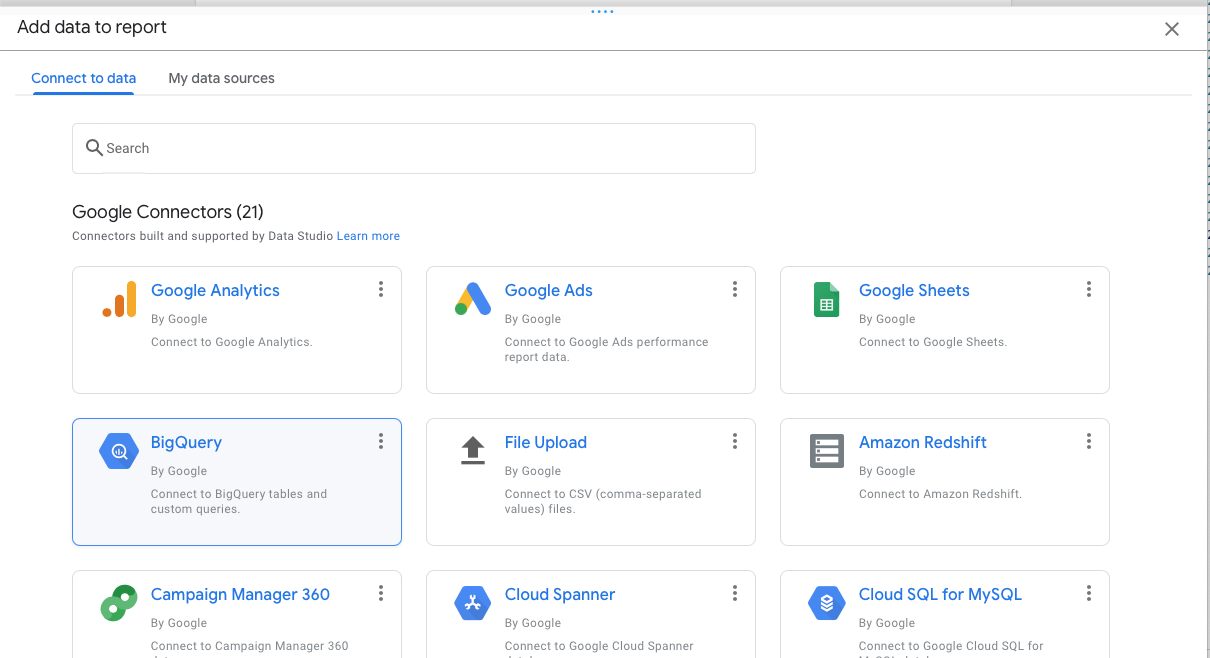
-
Follow the instructions to authorize Data Studio to access the BigQuery dataset.
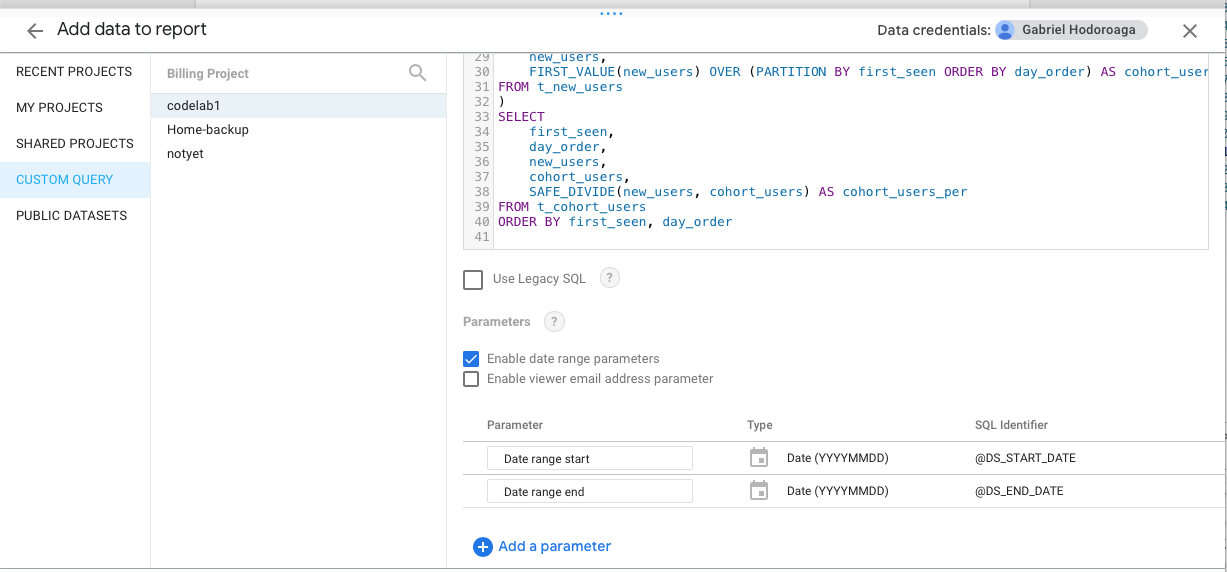
-
Choose “CUSTOM QUERY”, select project and paste the query from the previous step. Make sure to check the “Enable date range parameters” option and update the parameters
DS_START_DATEandDS_END_DATEwith the query parameters@DS_START_DATEand@DS_END_DATE.
-
Navigate to menu item **Resource -> Manage added data sources", click on “Edit” and update the fields names as follows:
- “cohort_users” becomes “Cohort users”
- “cohort_users_per” becomes “% Cohort users”
- “day_order” becomes “Day”
- “first_seen” becomes “First seen”
- “new_users” becomes “New users”
-
Add a text box for the title of the report, a date range control and a pivot table with heat map.
-
For the pivot table set the following options:
- Row dimension: First seen
- Column dimension: Day
- Metric: % Cohort users
- Sorting:
- Row #1: First seen ascending
- Column #1: Day ascending
- Style:
- Missing data: Show '' (blank)
-
Duplicate the pivot table and replace the metric with New users.
The final report should look like this:
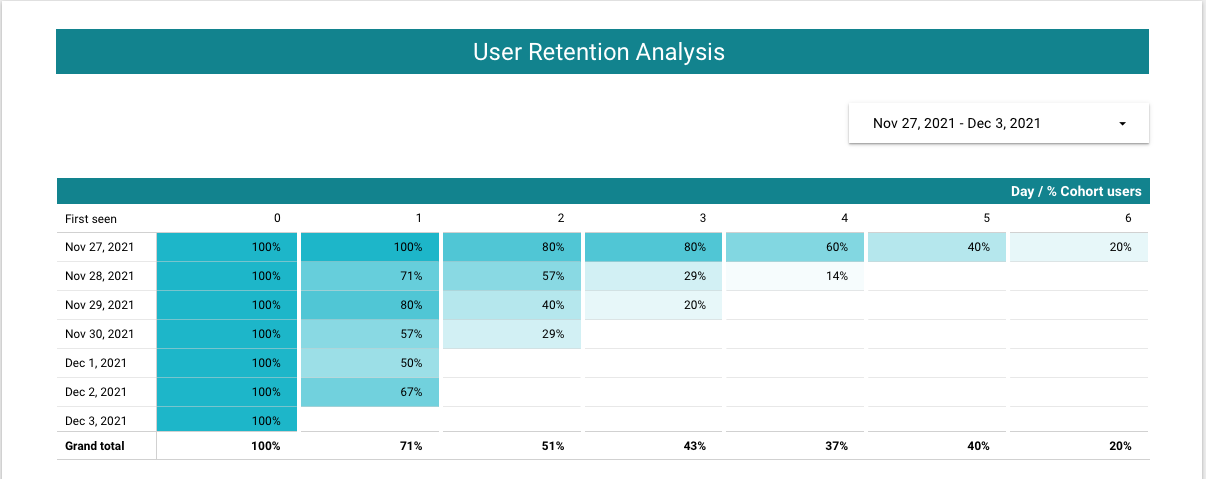
The live version of this report can be found here: User retention visualization
Conclusion
Data Studio is a great tool and in combination with BigQuery anyone can turn data into compelling stories of data visualization art.